The Pulse-Width
Finder program will be included in the next
candidate version of SpinAPI within the
RadioProcessor directory. Until then it
can be downloaded using the following link:
Pulse-Width
Finder download. The Pulse-Width Finder
program performs a set of single pulse NMR
scans with varying pulse width to find the 90
degree, 180 degree, and the 360 degree pulse
width. The batch file allows for a
graphical output using gnuplot, a free
plotting program. For more information,
please see the gnuplot section below. An
example of data obtained from running the
Pulse-Width Finder program is shown below in
figure 1.
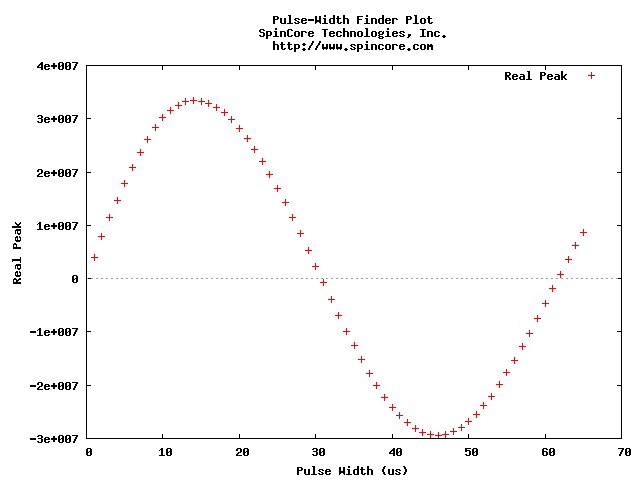
Figure 1: Example Pulse-Width Finder Plot
(generated by gnuplot)
The program also outputs the 90 degree, the
180 degree, and the 360 degree pulse widths
along with the pulse width of the maximum peak
and the minimum peak. The
pulse_width_finder.exe program takes multiple
command line parameters as seen below, and it
outputs all of the data in multiple formats
Currently the
Pulse-Width Finder works by first collecting
all the data for scans with varying pulse
widths. It then takes the first real
point from each scan, and finds where these
points cross the x-axis. The first
crossing is the 180 degree pulse width; the
second crossing is the 360 degree pulse
width. The 90 degree pulse width is
calculated by dividing the 180 degree pulse
width in half. This works if the plot is
close to a sinusoid like in figure 1, but if
there are cases when this may not be
correct. For those occasions, the
Pulse-Width Finder program also gives you the
pulse widths for the points with the
greatest real peak and the least real
peak. You can also eyeball the 90 degree
pulse width if you used enough steps. If
that is not good enough, the program outputs
all the pulse width and peak data to a .txt
file so you can perform your own algorithm to
find the 90 degree pulse width.
The Pulse-Width
Finder executable takes the following
arguments as inputs in order:
spectral_width
- The spectral width in kHz
adc_freq - Frequency of the ADC
in MHz
num_points - Number of points
acquired for each single pulse scan
num_scans - Number of single
pulse scans to run for each pulse width
blanking_delay -
The amount of time to de-blank the amplifier
before the excitation in ms
ringdown_time - The time between
the pulses and signal acquisition in us
repetition_delay
- The time between single pulse scans in
seconds
tx_phase - The phase of the
excitation pulse in deg
bypass_fir - Bypass the FIR
filter
blanking_bit - Bit used to
control the amplifier blanking (example:
0b00000001 is blanking bit 0, 0b00000010 is
blanking bit 1)
res_auto - Specifies if and how
often the resonance frequency is checked and
adjusted (see Automating Parameters section
below)
phase_auto - Specifies if the
output data will be automatically phased (see
Automating Parameters section below)
dc_auto - Specifies if DC
components caused by acquisition filters or
amplifiers are automatically removed (see
Automating Parameters section below)
res_pw - Pulse width to use for
resonance scans in us
min_pw - The lower end of the
pulse width range in us
max_pw - The upper end of the
pulse width range in us
step_pw - The step size for the
pulse width range in us
Automating Parameters:
There are multiple parameters for the
Pulse-Width Finder program that will automate
different tasks. Here is a description
of them and what they control:
res_auto - automatic
resonance frequency finder
- If res_auto = 0, then there will be no
changes to the spectrometer frequency.
- If res_auto = 1, then when the program
starts, it will find the resonance
frequency using a pulse width of
res_pw. It will set the
spectrometer to that frequency, and
continue the program with that same
frequency.
- If res_auto = 2, then the program will
find the resonance frequency at the
beginning of the program and during the
change from one pulse width to the
next. This keeps the system on
resonance throughout the entire
experiment.
- auto_phasing - automatically phases the
the tx_phase and the output data
- If auto_phasing = 0, then there is no
change to tx_phase or the phase of the
acquired data.
- If auto_phasing = 1, then tx_phase is
automatically determined at the
beginning of the program by finding the
phase of the first point of a single
pulse scan.
- If auto_phasing = 2, then tx_phase is
automatically determined at the
beginning of the program, and each data
set is kept on phase by phasing the raw
data with a rotation so the first point
is purely real.
- dc_auto - corrects for errors in dc
offset due to acquisition filters and
amplifiers.
- If correct_dc_offset = 0, there is no
change to the acquired data.
- If correct_dc_offset = 1, then the
last 1/4 of points in the real and
imaginary channels are averaged to find
the dc offset. Then that amount is
subtracted from both the real and
imaginary channels to correct for the
offset.
Pulse-Width Finder Output Files:
The pulse_width_finder.exe file produces many
output files. They all use
fname
as their prefix.
The
types of output files are shown below:
- fname_resonance.fid - Scan used to find
the resonance frequency
- fname_phase.fid - Scan used to find the
optimal tx_phase
- fname_calibrated.fid - Scan used to show
the results of the automatic resonance
finding and/or the automatic phasing
- fname_#.fid - Felix output from each
pulse width scan
- fname_final.txt - Stores the pulse width
in us, the real peak, and the imaginary
peak for each scan
- fname_pulse_widths.txt - Stores the
results from the automatic pulse width
finder (90 degree pulse width, etc.)
- fname_plot.gp - A gnuplot script to plot
the output figure. This program
generates fname_output.jpg which is a plot
of all the data from the program (see
figure 1).
Gnuplot Information:
The Pulse-Width Finder batch file has an
option that uses the program gnuplot to create
the output graph that shows the final
data. Gnuplot is a multi-platform
plotting program that is freely distributed at
gnuplot's
website. For this program, the
Windows binary download from
Source
Forge is sufficient. The
Pulse-Width Finder batch file calls the
gnuplot program to process and display the
data, so for that to work correctly, you need
to specify the location of gnuplot.exe in the
variable
gnuplot_path within the
batch file. Normal locations are
C:\Program Files\gnuplot\binary or
C:\gnuplot\binary, but yours may be different
depending on where you installed gnuplot..
Pulse-Width Finder Testing Tips:
- Use gnuplot to visualize your data by
downloading gnuplot and setting the
use_gnuplot parameter in the batch file to
1. For more information see the
Gnuplot Information section.
- Pick your range of pulse widths to
include two zero crossings.
Therefore the program will be able to
calculate the 90 degree pulse width, the
180 degree pulse width, and the 360 degree
pulse width. If you are not getting
results for the 180 degree pulse width or
the 360 degree pulse width, you are not
testing a large enough range of pulse
widths.
- If you are having trouble with the pulse
width finder, try using a small step size
and eyeballing the 90 degree pulse width.
- Make sure your repetition delay is long
enough. If your output graph has a
short rising time and a long falling time,
then you may need a longer repetition
delay to get better results.