|
T1 Inversion-Recovery Program
for RadioProcessor and iSpin-NMR
OverviewThe T1 Inversion-Recovery (T1IR) experiment applies a 180 degree inverting pulse, waits a period of tau,
then applies a 90 degree pulse to cause an FID response from the sample. It then repeats this pulse sequence with increasing durations of tau. The relationships of the
FID response peaks can be modeled with an exponential fit to determine T1, the Spin-Lattice relaxation time.
The length of the T1IR experiment can make it easy for
the magnet and sample to drift off resonance during experimentation and skew results. To prevent this, the T1IR program has the ability to use a Single-Pulse NMR scan to
automatically find and set the resonance frequency before each iterative Inversion Recovery scan. This auto-resonance feature will increase run time, but prevent any
off-resonance drifting.
The T1IR program is available
for download at the bottom of this page.
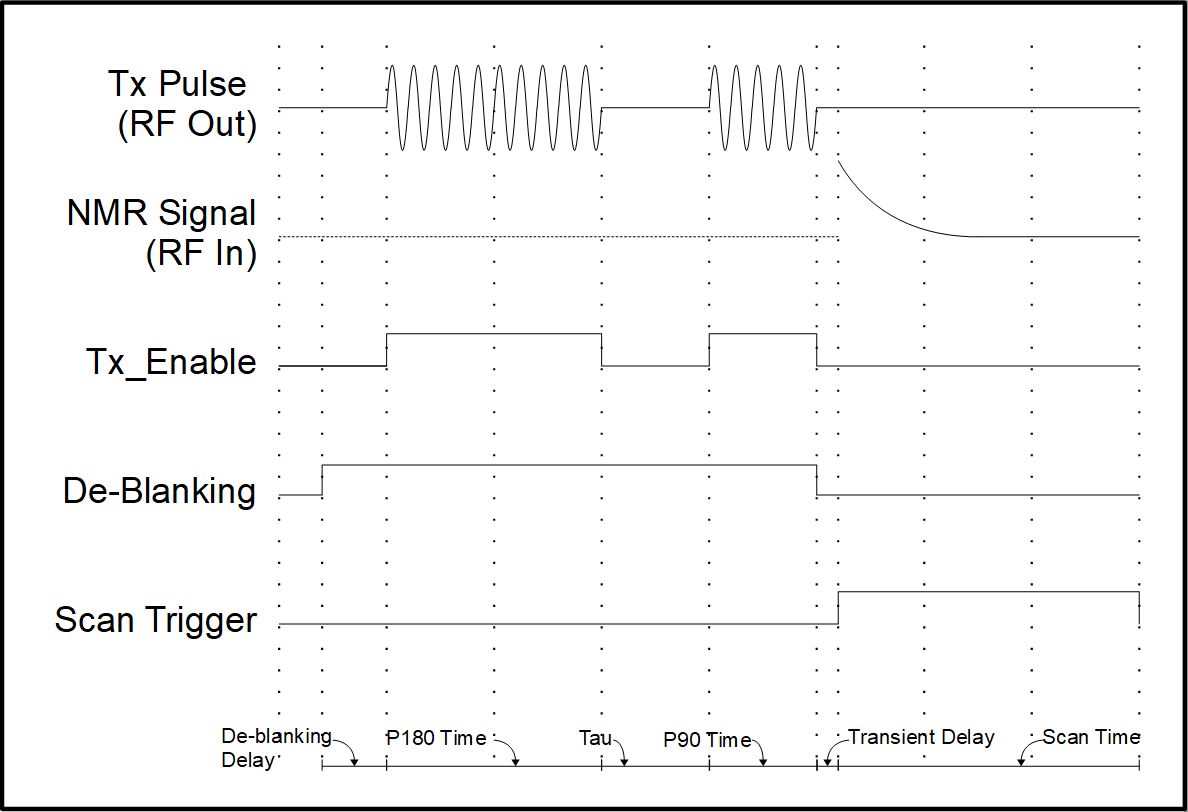
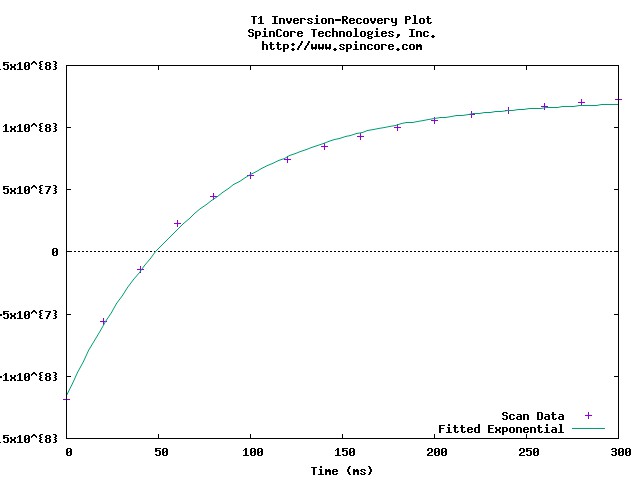 Figure1. T1IR Manual Range Results (16 tau steps, tau range: 0.1ms - 300ms, a sample of household cooking oil using a 10.8MHz permanent magnet) Figure 1 shows the resultant FID peak response when manually ranging tau. Figure 2, below, shows the pulse sequence used
by the RadioProcessor to perform this
experiment. Each vertical line is a new
instruction, and the names of the durations used
are shown above each time range.
Figure2. T1IR Pulse Sequence
Running the T1IR Program
The T1IR program accepts command line parameters
to specify the values for
each of the pulse program's parameters. It takes the following arguments as inputs:
Argument
|
Parameter
|
Units/Values
|
1
|
File Name
|
|
2
|
Board Number
|
#
|
3
|
De-blank Bit
|
0, 1, 2, or 3
|
4
|
Debug |
0 or 1
|
5
|
ADC Frequency
|
MHz
|
6
|
Spectrometer Frequency
|
MHz
|
7
|
Spectral Width
|
kHz
|
8
|
Amplitude
|
0.0 - 1.0
|
9
|
90 Degree Pulse Time
|
us
|
10
|
90 Degree Pulse Phase
|
degrees
|
11
|
180 Degree Pulse Time
|
us
|
12
|
Bypass FIR
|
0 or 1
|
13
|
Number of Points
|
#
|
14
| Number of Averaging Points
| #
| 15
| Number of Scans
| #
| 16
| Tau Steps
| #
| 17
| Auto Tau Range
| 0 or 1
|
18
|
Auto Tau Range Seed
|
ms
|
19
| Step Distribution
| #
| 20
| Minimum Tau
| ms
| 21
| Maximum Tau
| ms
|
22
|
De-blanking Delay
|
ms
|
23
|
Transient Delay
|
us
|
24
|
Repetition Delay
|
s
|
25
| Correct DC Offset
| 0 or 1
| 26
| Auto Phasing
| 0 or 1
| 27
| Auto Resonance
| 0 or 1
|
Table1. T1IR Input Arguments
These arguments must all be passed as input parameters when launching the T1IR.exe file. Omitting or passing arguments out of order will cause the program to return an error.
To simplify this process, a T1IR.bat file is provided. This file allows for easy manipulation of argument values, and ensures that they will passed in the correct order.
To use the T1IR.bat file simply: - Open the T1IR.bat file in a text editor
- Set the parameters to the desired values
- Save any changes made
- Ensure that the T1IR.bat and T1IR.exe files are in the same directory
- Double-click the T1IR.bat file
After following these procedures, the T1IR.exe will run with the
specified parameters and print those parameters as well as the progress of the experiment to a terminal window. Once experimentation is finished, it will save the results to ASCII, JCAMP, Felix,
and gnuplot files. If gnuplot has been installed, the T1IR.bat file will automatically run gnuplot with the outputted gnuplot file. This will calculate a value for T1 as well as display a plot of
the data.
Viewing T1IR Results
After execution of the T1IR program, the output files can be used with external programs to visualize the data. The T1IR
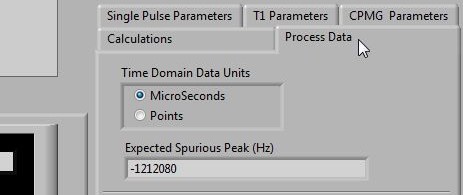
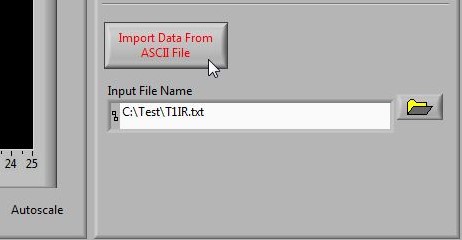
program wills The LabVIEW NMR Interface can process .txt files. To do this: - Navigate to the 'Process Data' tab
- Point the 'Import File Name' path to the T1IR's .txt output.
- Press 'Import Data From ASCII File' to view the data.
The Felix NMR program can process .fid files. To do this simply ensure that the Felix NMR program
is installed properly and double-click on the .fid file. Gnuplot can process .gp files. To do this: - Download and install the latest version of
gnuplot.
- Use the default installation settings.
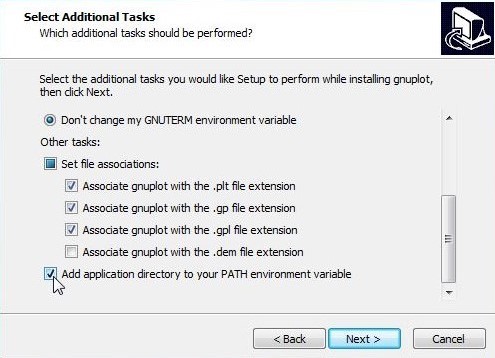
- To be able to automatically open gnuplot with the .bat file, make sure to
check 'Add application directory to your PATH environment variable' in the 'Select Additional Tasks' window.
- If gnuplot has been setup to be called in the terminal, results should automatically be viewed after each execution of the .bat.
- If for whatever reason gnuplot is not running from the terminal, results can still be viewed by running the .gp file in the dedicated gnuplot GUI.
To do so:
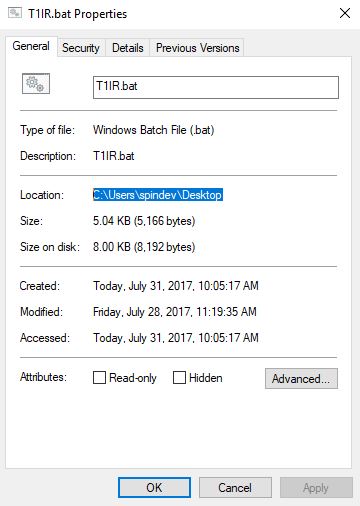
- Identify the directory containing T1IR.exe and T1IR.bat. This can be found in the T1IR.bat's properties window:
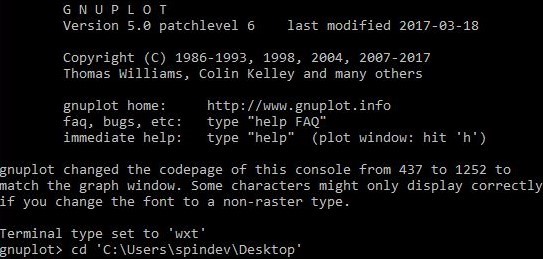
- Launch gnuplot.exe.
- Point gnuplot to the directory by inputting the following command to the gnuplot terminal:
cd '<directory address>'
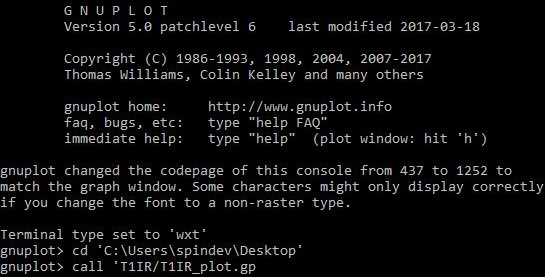
- Call the gnuplot script with the following command:
call '<T1IR_filename>/<T1IR_filename>_plot.gp'
- View the generated T1 value and output .jpg.
T1IR Acquisition Tips
Setting the input parameters correctly is critical in obtaining good T1IR data. Below are suggestions for determining these parameters:
- Start with a simple Single-Pulse NMR
experiment:
- Find the values of spectral width and number of points which optimize the signal-to-noise ratio without cutting off the FID.
- Find the 90 and 180 degree pulse widths. These are the amounts of time it takes for a transmitted pulse to cause a 90 and 180 degree FID response. The 180 degree pulse width should be roughly double that of the 90 degree pulse width.
- Find the resonance frequency
and output phase which achieve a maximum real amplitude at the start of acquisition. The value of the first real data point should be a maximum, and the value of the first imaginary point should be zero.
- These procedures are done using the LabVIEW NMR Interface.
- Use the established Single-Pulse NMR parameters with the
T1IR program. The relevant parameters are:
- BOARD_NUMBER
- ADC_FREQUENCY
- SPECTROMETER_FREQUENCY
- SPECTRAL_WIDTH
- AMPLITUDE
- P90_TIME
- P90_PHASE
- P180_TIME
- TRANSIENT_DELAY
- REPETITION_DELAY
- Do an initial run of T1IR. Start with a broad range of TAU values and use a number of TAU_STEPS of around 16 points.
- Using this initial value of T1, edit the TAU range by setting TAU_MAX to around 4*T1.
- Finally, adjust the number of TAU_STEPS as desired to get more or less curve resolution. You can also increase the NUMBER_OF_SCANS parameter to average results over multiple runs. This will improve signal-to-noise ratio.
- If the results appear to be drifting off resonance during iterative scans, make sure to set AUTO_RES to 2. This will ensure that each iterative T1IR scan will be on resonance.
Download
|